With the arrival of the pandemic, how could we analyze the dispersion of COVID-19 across a vast territory like Rio Grande do Sul, to inform the public?
And how can we understand the specific dynamics in its most critical area, the Porto Alegre Metropolitan Region?
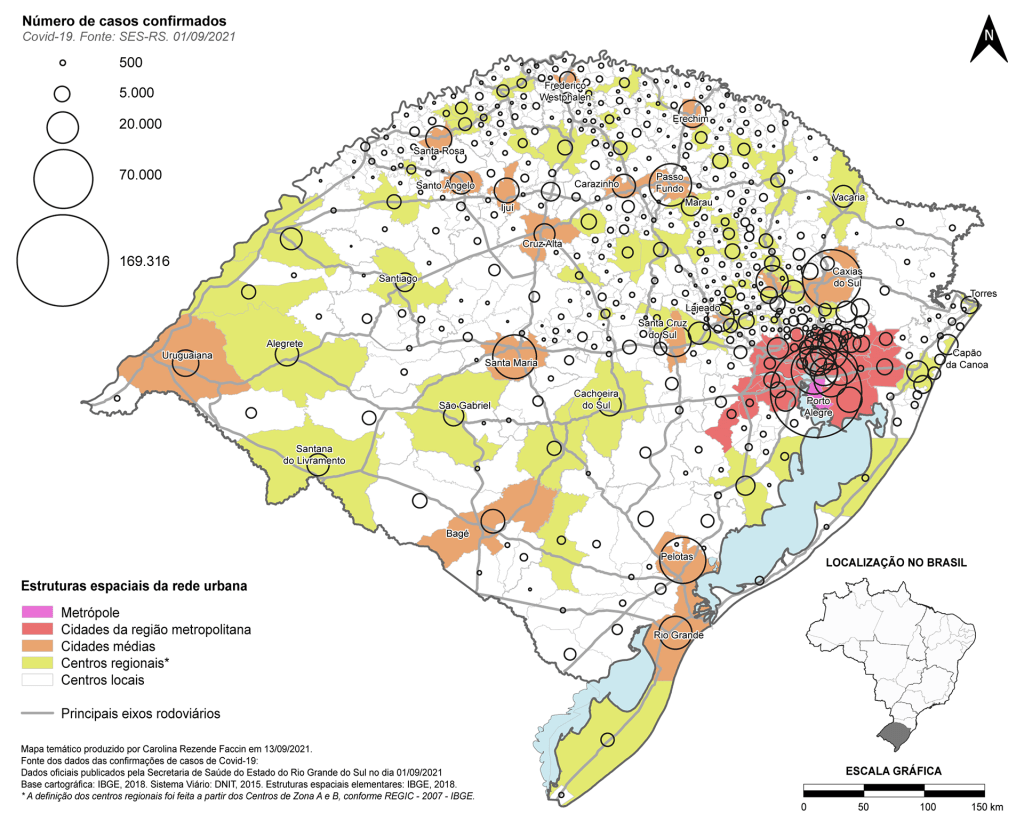
Analysis at the Rio Grande do Sul Scale:
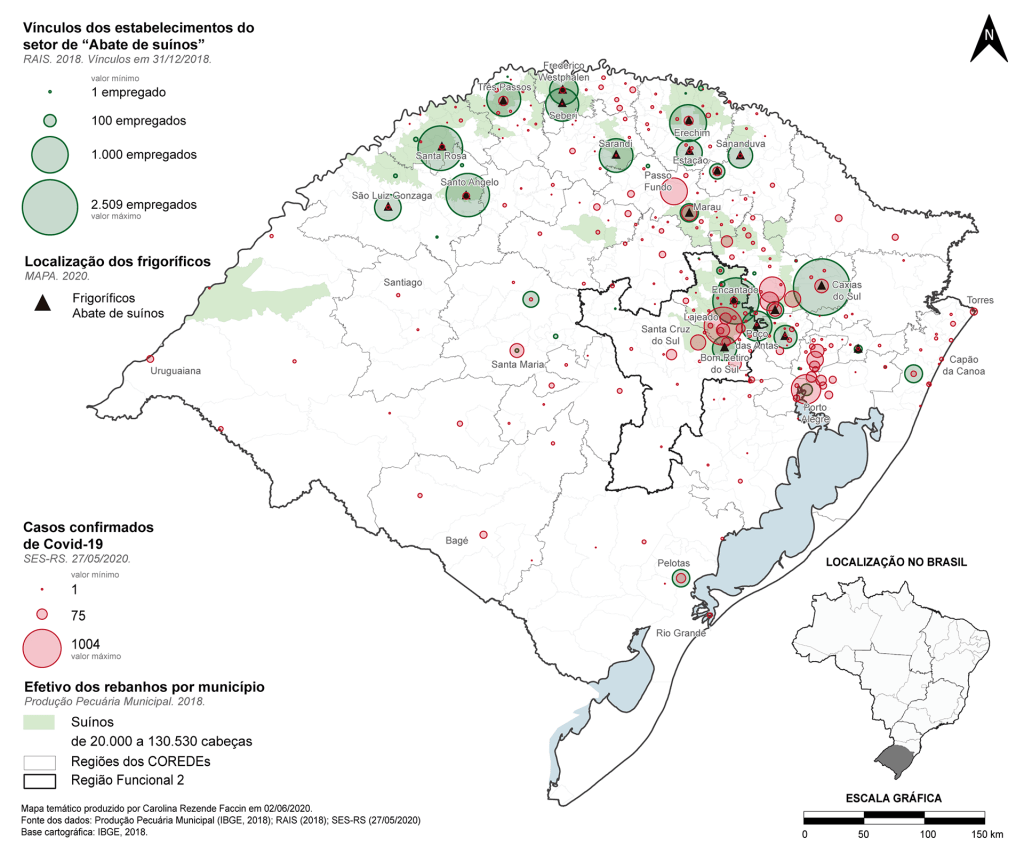
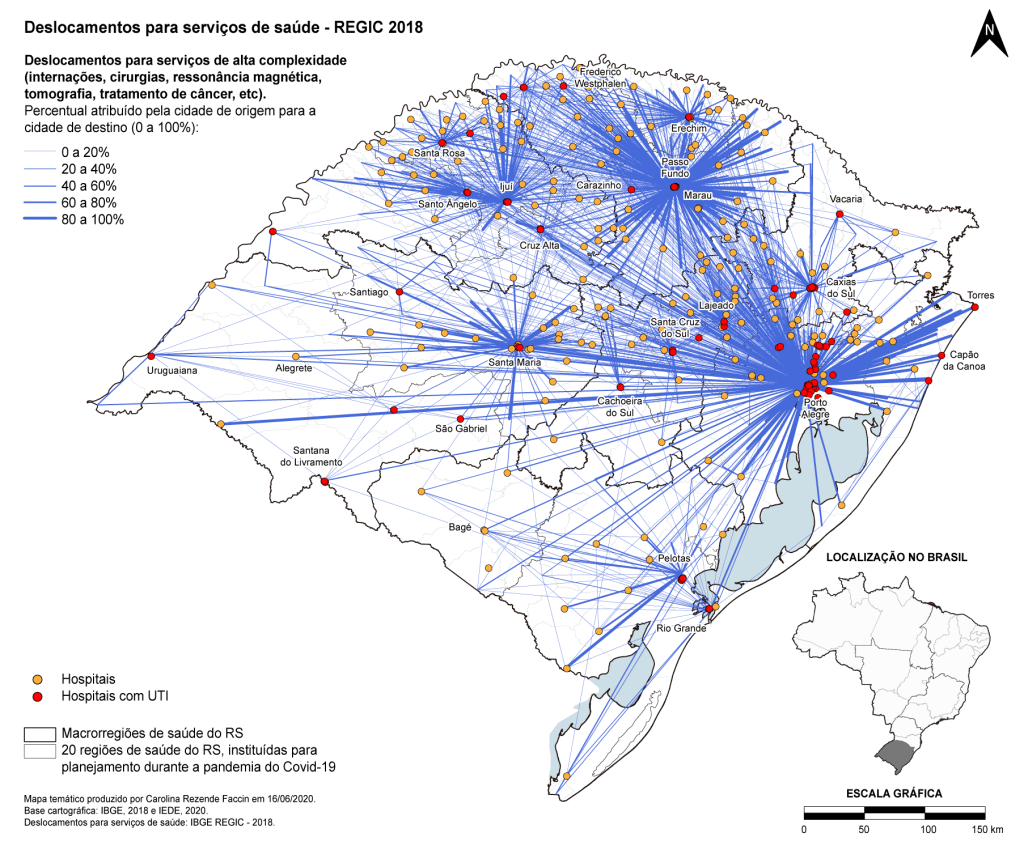
Initially, as part of the ObservaDR/COVID-19 project (which involved over 20 researchers), I analyzed the dispersion of COVID-19 across the 497 municipalities in Rio Grande do Sul, utilizing PostGIS and SQL databases to process and map large volumes of data.
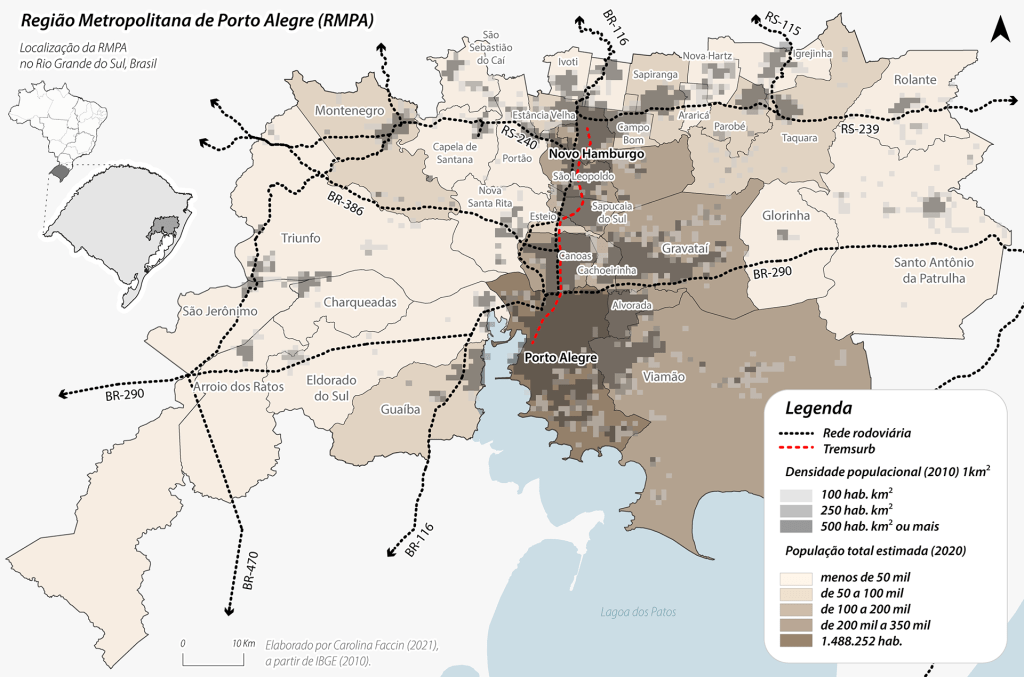
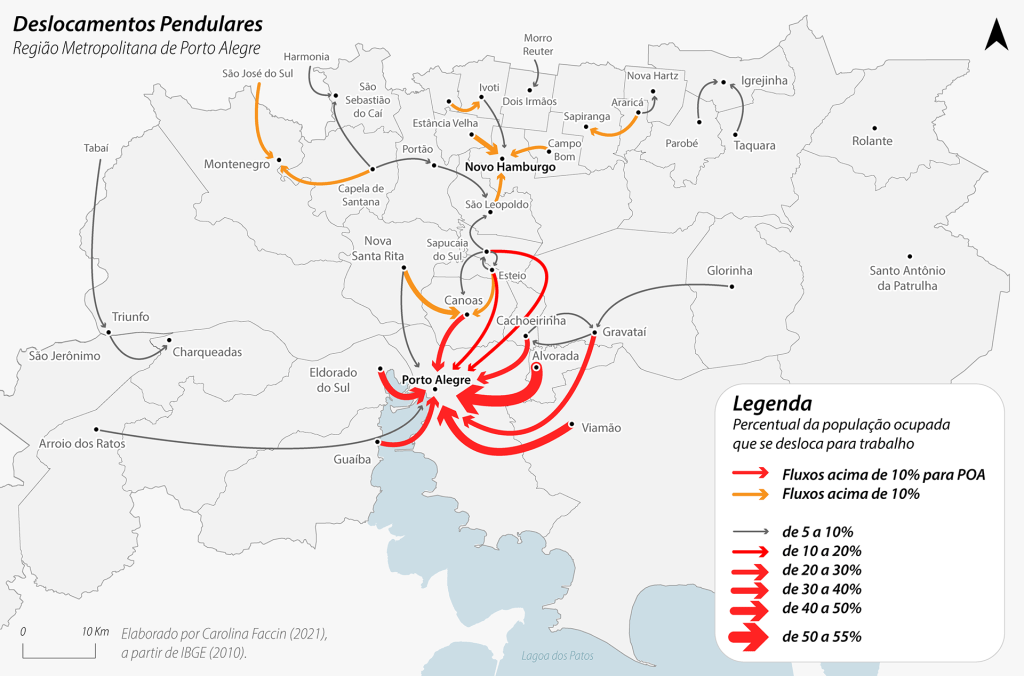
Analysis in the Metropolitan Region:
Subsequently, I applied the methodology to a study in the Porto Alegre Metropolitan Region (RMPA). In a smaller team, I was responsible for enhancing a specific database and conducting data analyses to detail the virus dispersion patterns in the state’s most densely populated area.
Data Sources: Health Secretariats (State and Municipal), Open Data (Brasil.io), IBGE, MAPA, FEPAM.
Tools: Geoprocessing (QGIS), Database (PostgreSQL/PostGIS), Data Analysis (SQL, Excel, Python), Data Visualization (Adobe Illustrator).
Publications:
- Faccin et al. (2021) (pt-br): The first year of the pandemic in the Porto Alegre Metropolitan Region, RS
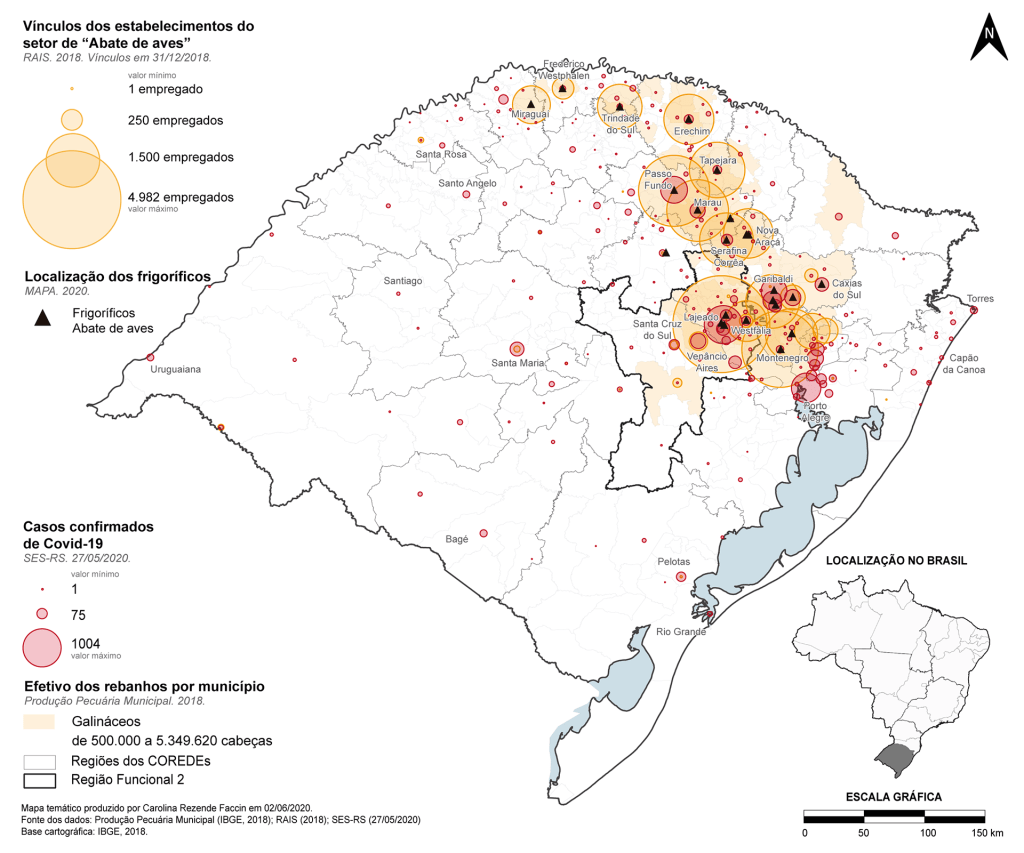
- Silveira, Cazarotto, Faccin & Vogt (2020) (en): Analysis of the spatial pattern of COVID-19 dispersion in the Vales Region and medium-sized cities.
- Stavizki Junior, Faccin & Silva (2022) (pt-br): Study on the effectiveness of the Controlled Distancing Model of RS in the municipality of Santa Cruz do Sul.
- Giacometti & Faccin (2024) (pt-br): Statistical and spatial analysis of the two years of the pandemic in the Vales Region-RS.